
Replacement Asset Value (RAV)
What is replacement asset value (RAV)?
When used for maintenance purposes, RAV represents the current cost to replace all of the assets that you are spending money on maintaining. RAV can be a useful metric to inform your overall asset management strategy.
For the purposes of this article, we are only interested in the replacement asset value of those assets on which we spend maintenance dollars.
If we don’t pay to maintain it, we don’t need to know its RAV.
Why is RAV important for improving maintenance efficiency?
RAV forms a part of a simple calculation that measures the annual maintenance costs (MC) against the total RAV of the plant.
The output is a percentage that allows companies to benchmark their maintenance performance — both internally and against their direct competitors.
The MC/RAV calculation measures two components of your maintenance program:
- Effectiveness: Your maintenance may be very effective with high asset reliability, healthy asset life cycle, and minimal overtime. However, if your maintenance costs are higher than industry benchmarks, you are over-maintaining your equipment and/or you have a problem with efficiency.
- Efficiency: If you suffer poor reliability, high emergency maintenance costs, and high inventory costs, your team may still be highly efficient, but the effectiveness of your maintenance program is definitely poor, and asset performance is likely lacking.
In both cases, your MC/RAV calculation will be higher than normal, signaling a problem.
How to calculate your MC to RAV percentage
The MC to RAV calculation looks rather simple at first glance.
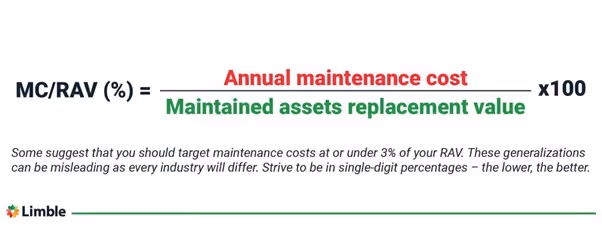
MC/RAV (%) = (Annual maintenance cost / Maintained assets replacement value) x 100
While the equation is trivial, the challenge lies in deciding what to include and exclude in those two main variables. Let’s look at each figure in turn.
Finding the Annual Maintenance Costs figure
The annual maintenance cost figure should only include the costs spent on:
- Routine maintenance
- Asset repairs
- Troubleshooting
- Corrective maintenance.
Exclude non-maintenance-specific costs like small capital works, modifications, and improvements in safety. These will inflate the true maintenance cost.
Finding the Replacement Asset Value figure
If you have a relatively new plant, you can use the original capital cost and apply inflation for each year since construction. Your accountant should have asset value details on hand.
Use the depreciated asset values for an old plant and adjust for the average depreciation figure and the average inflation rate on your existing assets.
These replacement costs will not be exact, but that is okay. We are looking for a reasonable approximation of RAV to use as a data input. If you’re plus/minus 10-15% of the actual figure, that’s fine.
A practical example of the MC/RAV calculation
In this example, we’ll assume a plant of 8 years, with moderate capital and expansion investments in the 4th and 6th year.
The average inflation rate is 2.5%, and we’ve adjusted the initial cost and intervening investment to give a present value at the end of year 8.
On reviewing our maintenance budget for the year, we’ve removed some costs used for environmental modifications and small capital works. For the purpose of this example, we have estimated that the annual maintenance costs for this plant equal $74,552.
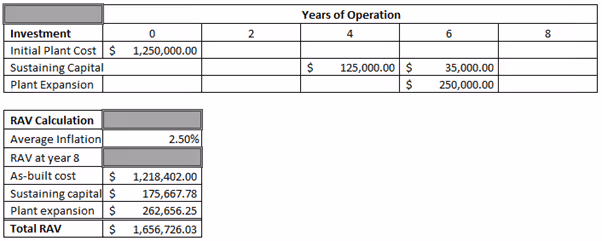
MC/RAV = ($74,552 / $1,656,726) x 100
MC/RAV = 4.5%
Our annual maintenance costs equal 4.5% of the replacement asset value of our plant. A good result, but there is room to improve efficiency.
Here’s another way to think about the MC/RAV number:
- If we had calculated a high percentage, like 18%, we would have spent so much on maintenance that we could have replaced the entire plant after 5.5 years.
- Based on the 4.5% figure we calculated above, the business can operate for more than 22 years before maintenance spending equates the cost of a new plant.
- If the figure was as low as 2%, our maintenance costs would match plant replacement value only after 50 years.
While the above example looks at the plant level, the same can be done on an asset level. You can look at the asset replacement valuation and its yearly maintenance costs when deciding should an asset be repaired or replaced.
MC/RAV industry benchmarks
You’ll hear people suggesting that you should target maintenance expenditures at, or under, 3% of your RAV. While this may be true for some, every industry will differ.
Many variables affect what is normal in your industry, including:
- Company size
- Geographical location
- Industry
- Product produced
- Plant complexity
- Equipment purchase price and its ongoing maintenance cost
For instance, if you have static assets in a benign environment, you can expect a lower MC/RAV percentage than in a highly regulated and complex industry operating in a corrosive environment.
Whatever your case might be, you should aim to reduce the percentage without destabilizing your maintenance effectiveness and reliability. Strive to be in single-digit percentages — the lower, the better.
You may struggle to find reliable industry benchmark data against which to measure your performance. If so, use the percentage as an internal KPI supporting a continuous improvement initiative.
Ways to lower your MC to RAV percentage
Improving your MC/RAV performance consists of a layered approach to maintenance and includes the following tactics.
1) Implement a proactive maintenance program
Plan and implement proactive maintenance programs comprising a mix of condition-based, preventive, and predictive maintenance strategies.
Calculate the MC/RAV percentage figure each year to track your improvements and help optimize your maintenance decisions.
2) Use a computerized maintenance management system (CMMS)
Using a CMMS automates much of your maintenance data management, which will help you capture costs, maintenance histories, and failure trends on a very detailed level.
You will be able to make smart repair or replacement decisions and recommend whether a specific maintenance task should be done in-house or outsourced.
With a capable CMMS, you’ll gain deep insights into your maintenance spending, allowing you to make informed operational and tactical decisions.
3) Broaden your maintenance training
By creating a broader awareness of the cost and impact of maintenance, you can enable your technicians to make decisions that are focused on cost efficiency while maintaining effectiveness.
Your maintenance training should aim to introduce topics beyond simple maintenance upskilling, like:
- The financial impacts of different maintenance decisions
- The importance of having accurate and clean maintenance data
- The basic concepts of equipment reliability.
By creating greater awareness of issues that aid or hinder business success, you will hand them the knowledge they need to support your strategic goals.
4) Analyze in-house vs outsourced maintenance work
Audit your maintenance contracts to understand how success is measured and rewarded:
- Does the contractor share in any gains from improved reliability?
- What happens if you fail to meet the equipment availability KPI?
- How does the cost compare to upskilling your technicians to perform the same job in-house?
The original reasons for outsourcing equipment maintenance get lost over time. Regular, scheduled reviews allow you to assess whether a change in strategy might be required – while amending contracts to support outcomes, not attendance.
A clear path for improvement
Calculating your replacement asset value and maintenance costs provides the basis for a comprehensive maintenance improvement program. You’ll have the levers to improve your financial position while increasing equipment availability and becoming more competitive in your industry.