


Optimize preventive maintenance for peak production
Slash downtime, simplify work orders, and give your team real-time visibility to stay ahead of failures—so operations never miss a beat.


Smarter maintenance, smoother operations
Simplify work orders, keep assets running smoothly, and increase productivity across every site.
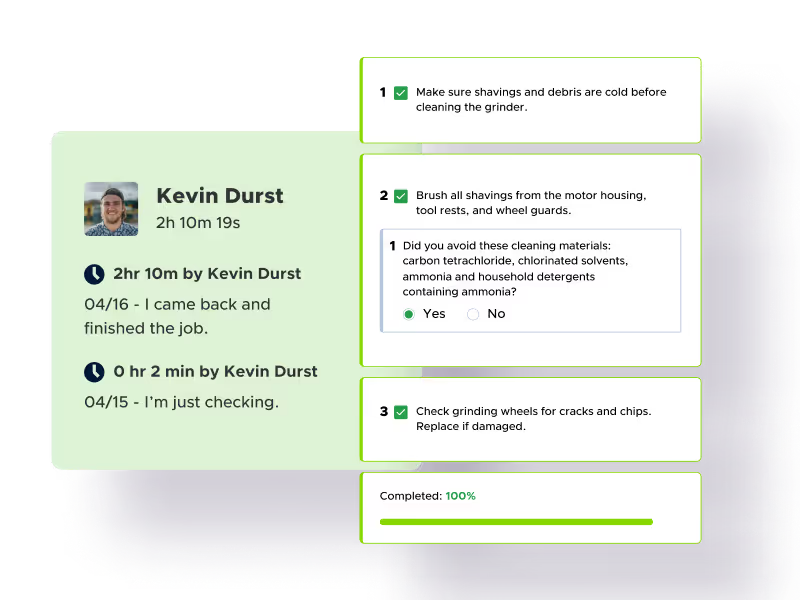
Work orders, simplified
Assign, complete, and track work orders from anywhere. Submit requests with QR codes, get real-time updates, and keep technicians focused on the work.
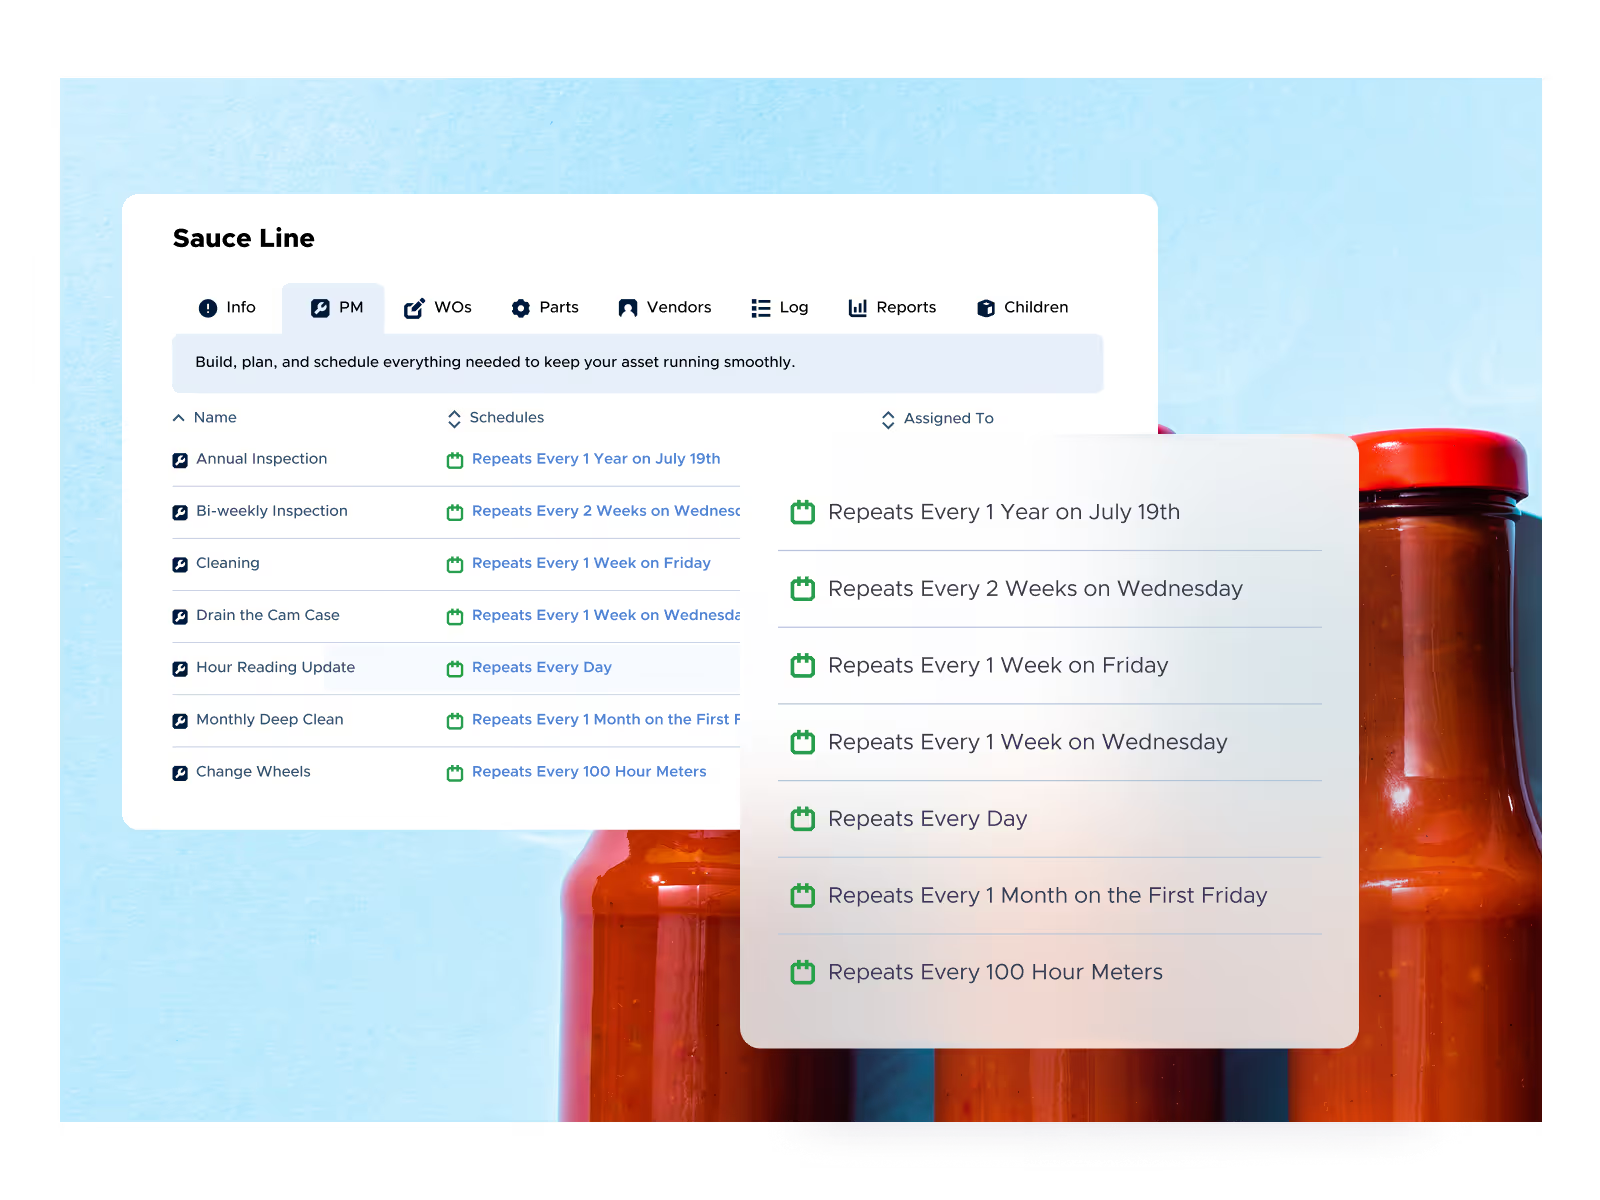
Prevent downtime before it costs you
Unplanned downtime costs 10x more than preventive maintenance. Automatically schedule PMs, track downtime trends, and stay ahead of failures.
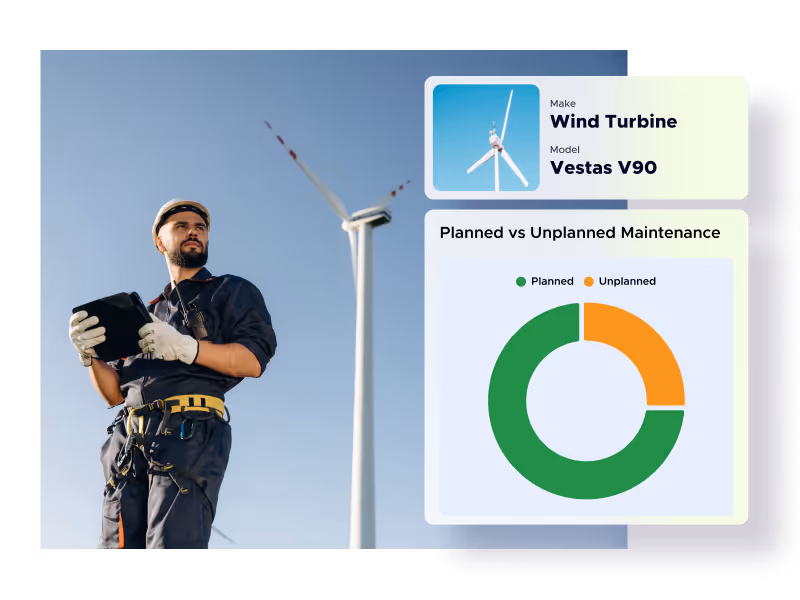
See the big picture and make decisions with confidence
Track downtime, costs, and asset performance in real time. Use dashboards and reports to spot trends and improve maintenance performance.
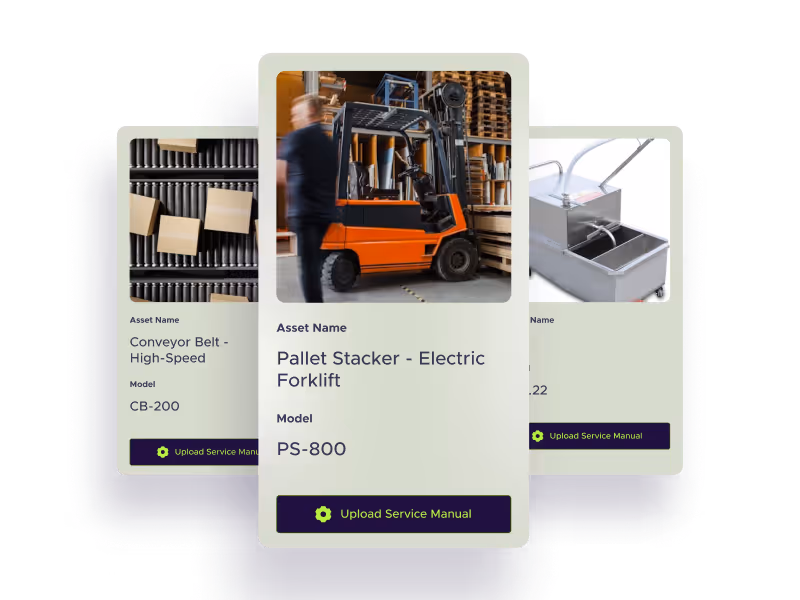
Spend smarter and keep assets running longer
Track asset history and spare parts in real time. Keep inventory acurate and get alerts before critical parts run low.
Proven results, measurable impact


Eliminate production blindspots with real-time collaboration and insights

Start seeing results quickly
Achieve results fast with ongoing guidance
Implementation your way
Drive team adoption with expert guidance and a tailored plan for lasting success
24/7 support
Get the help you need, whenever you need it, with response times under 60 seconds
Dedicated success team
From starting out to scaling up, hit every milestone with your Success Manager (plan limitations apply)
Training and resources
Stay ahead with hands-on training, an active maintenance community, and a robust video library
Empowering the humans who keep the world’s assets running

Ready to learn more about Limble?
Schedule a demo or calculate your price right away.